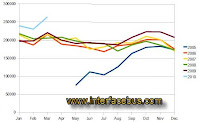
The numbers are in from last month, so I guess I should post them. The numbers seems to be on the increase, more than I figured. Although I can always predict the out-come based on the average numbers ~ maybe 10,000 visits per day, and 5,000 on the week-ends. However I did not expect to see the large jump in page views, which is finally up to the numbers back in 2006. I guess the trick now is to keep the numbers up there~
How to read the data:
Server Bandwidth:
The lowest curve is server bandwidth and does not relate to the other numbers on the chart. The bandwidth is hovering around 148,000 [in the graph] but really equates to 14G Bytes as the numbers were changed to fit the graph. I track bandwidth just to make sure the server does not see a heavy load.
Unique Visits:
Are visits from a computer within a month, but any one computer is only counted one time. If any one computer returns for a second visit it's counted by the Visits curve.
Visits:
A site visit is registered each time a person visits the site within a month and each time the person returns to the site. Site Visits should always be equal to or greater than Unique Visits.
Page Views:
Are the number of pages a person views per month, regardless of how many times the visitor returns to the web site. Page Views should always be equal to or greater than Site Visits. Page views are really the only data point that is falling. Page Views is related to Bounce Rate, which is the percentage a person visits one page and then leaves the site.
Another way to see the same data, as site visits, or number of visits ~ so a comparison can be made year over year. This chart makes it easy to see that site visits are higher than any other month and any previous year.
2005 was the year I started to follow Search Engine Optimization [SEO] techniques. I guess the SEO stuff really works.


No comments:
Post a Comment